
Asset illustration
Asset-class illustration. Not an image of the offered collateral.
Commercial · CRE Multifamily
Still River Realty LLC
CU Loan Participation1 loan · 90% participation
$5,500,000.00$5.5M
Whole loans and loan participations
Go from a loan tape to total return projections, balance sheet impact and board-ready reports on one platform.
Impact on your institution: capital, income and rate risk, today and with the pool. Figures are shown to account holders.
Call report counts as of June 30, 2026.
On the board now
Explore the collateral, compare the opportunity, and open the offering for a closer look.
Asset-class illustration. Not an image of the offered collateral.
Commercial · CRE Multifamily
$5,500,000.00$5.5M
Asset-class illustration. Not an image of the offered collateral.
Commercial · CRE Multifamily
$2,000,000.00$2.0M
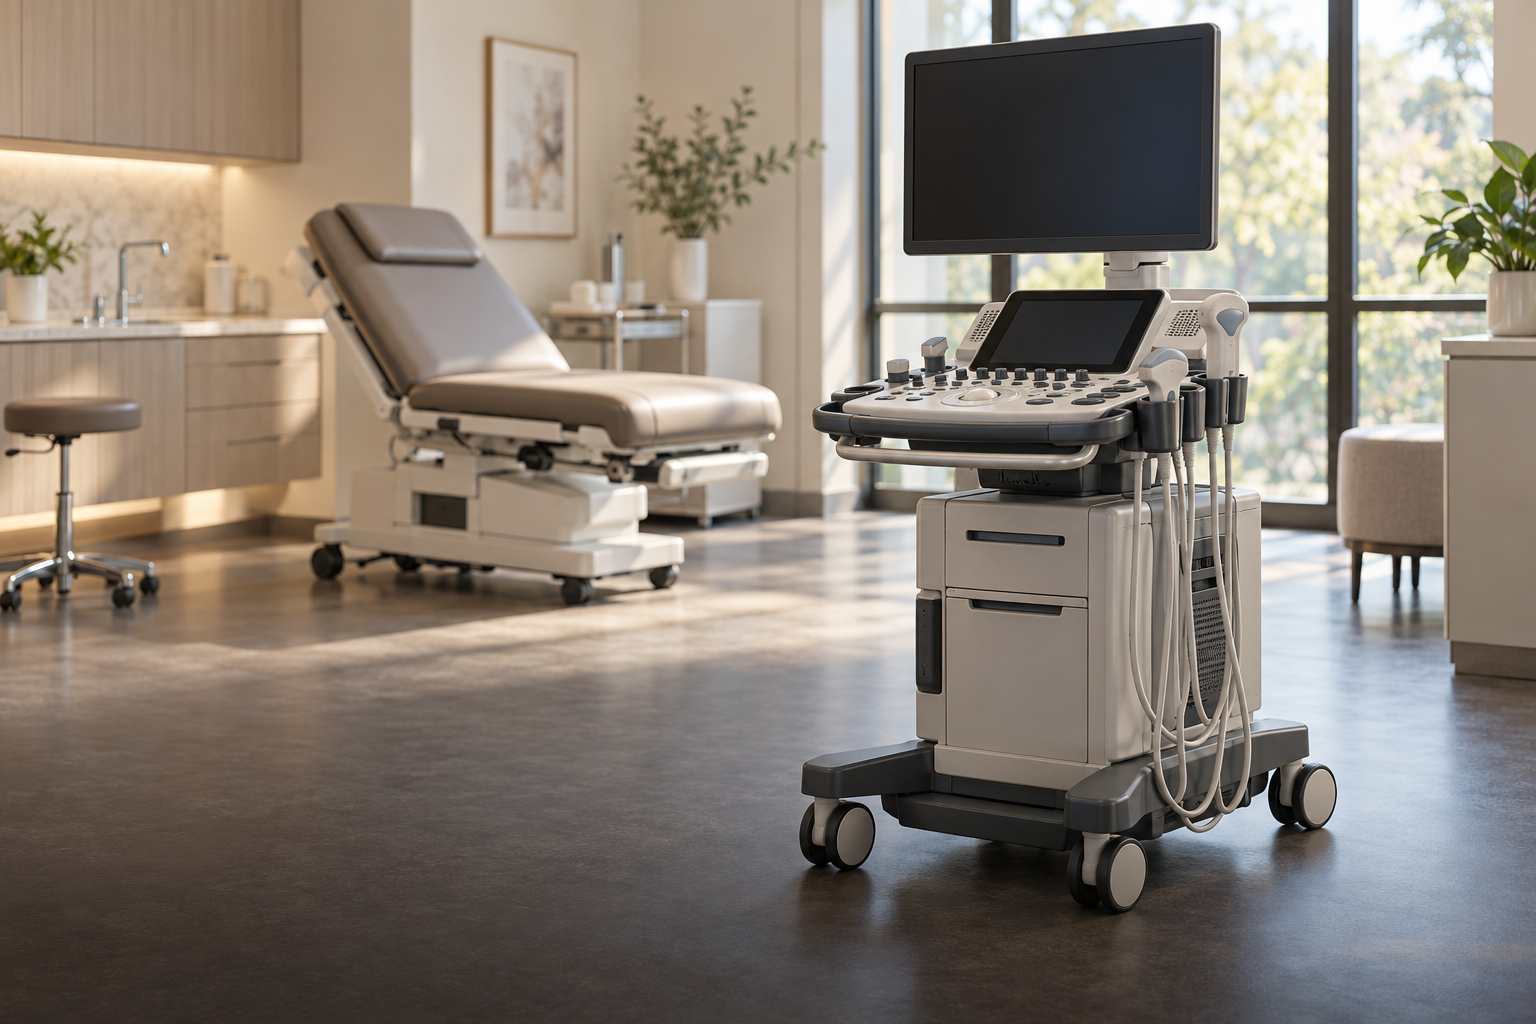
AI-generated representative imagery. Not a photograph of the offered collateral.
Lease · Medical Equipment Lease
$7,565,060.51$7.6M
Analysis for your decision
Review projected cashflows and returns, the modeled effect on your institution, and a selection that fits your book. Available results depend on the loan data, filing coverage and selected assumptions.
Cashflows for every loan. Yield, WAL, duration and option-adjusted spread on a Hull-White rate model, from -300 to +300 basis points, with CECL and total return over one, three and five years.
Scenario analysis: yield, WAL, duration and price at each of the seven rate shocks. Figures are shown to account holders.
Why LoanBook
Bring the opportunity, loan-level analysis and institution impact into the same decision. Compare modeled outcomes alongside the source data and offering terms.
For supported pools and institutions, model the effect using your institution’s available call report: the change in your capital ratio, your annual net interest income and your economic value of equity at +200bp. Credit unions and banks each get their own vocabulary and tax treatment.
Explore the same analytics engines the trading desk uses: cashflows for every loan, yield and WAL, option-adjusted spread on a Hull-White rate model, seven rate scenarios from -300 to +300bp, CECL, and total return over one, three and five years.
How it works
Start with an offering or your own portfolio. Review the analysis, request access and work with the desk through diligence and settlement.
Pricing and balance sheet impact before you commit, reporting after you settle, all on the same page as the NDA and the data room.
How buying worksSend the tape you have. The desk prices it with the same analytics buyers see, takes it to institutions it fits, and runs diligence, settlement and monthly reporting in one place.
How selling worksBuilt on the regulators' data
Institution analysis uses available FDIC and NCUA call reports and FFIEC CRA exam history. Review each institution’s filing date and any missing-data notices.
Evaluating LoanBook for your institution? Review our security methods and contact the desk for your IT review. Model outputs are estimates, not guaranteed returns or regulatory approval.
Explore public offering summaries, then get started for account access and institution-specific analysis. Confidential documents require the applicable permissions and NDA.
Impact on your institution: capital, income and rate risk, today and with the pool. Figures are shown to account holders.
AI-generated representative imagery. Not a photograph of the offered collateral.
Lease · Medical Equipment Lease
$4,742,437.05$4.7M

AI-generated representative imagery. Not a photograph of the offered collateral.
Residential · 1-4 Family Residential
$10,602,951.19$10.6M
AI-generated representative imagery. Not a photograph of the offered collateral.
Residential · 1-4 Family Residential
$10,782,963.28$10.8M
Pricing requires account access. Confidential documents and loan tapes also require the applicable deal permissions and NDA.
Basis points, parallel shifts. Levels open with an account.
Capital ratio, annual net interest income and economic value of equity at +200bp, today and with the pool, in your charter's own vocabulary and tax treatment.
Impact on your institution: capital, income and rate risk, today and with the pool. Figures are shown to account holders.
Want part of a pool? Choose a goal and supported limits to model a selection at the published offering terms. Review feasibility, assumptions and your institution’s policies before proceeding.
Carve for me: a goal, the buy box and limits, and the loans selected with their balance and yield. Figures are shown to account holders.
Product-specific prepayment, default and loss-severity models use their supported calibration data and economic inputs. County-level context informs supported models where available; assumptions and coverage matter.
Choose a goal and supported buy-box constraints to model a selection at published offering terms. Review feasibility and your institution’s policy and regulatory requirements before proceeding.
Available FDIC bank and NCUA credit-union financials, together with FFIEC CRA exam history, support institution research and impact analysis. Filing dates and coverage remain visible.
The offering, the NDA, the data room, diligence requests, closing review and the monthly remittance report all live on the same deal page, with a tracker that shows where the trade stands and the one thing it needs next.